If your forecasters were the sort of people who could precisely nail the outcome of a random, chaotic, complex system, day in and day out, then they wouldn’t be forecasting your call centre. They would be playing the euro-millions lottery for 5 minutes every Friday and spending the rest of the time cruising the shores of the Mediterranean in a Ferrari.
And so it is. In a complex, dynamic and constantly varying environment, with mere math and some historical data to cling to, you know only one thing; it will never ever be 100% accurate. Sure, we all try to get close to the reality, and spend ages on number crunching data to predict pretty outcomes, but the question here is; how much time should you spend on this? Don’t get me wrong; I think that forecast volume in call centers is a necessity to obtain some appropriate servicelevels and occupancy rates, however the step from 85% to 90% accuracy isn’t always bringing you a proportional cost reduction or customer satisfaction.
The Pareto principle, also known as the 80/20 rule, states that 80% of the outcome is caused by 20% of its causes. You can read more about this on Wikipedia if you’d like. This principle is used in many ways, here we could say; 80% of the accuracy of your forecast is based on 20% of the time you spend on it. So, when achieving a staffing accuracy of 85% (weektotals, eight weeks in advance) with two fulltime forecasters (40 hours a week per person, so in 80 hours), 80% of that 85% (which is 68%) is done within 16 hours. So you're spending about 1,6 fte on improving this forecast from 68% to 85%. What does that brings you in terms of servicelevel for instance? A nice one to think about and calculate some scenario’s upon when you’ve got a few hours to spend. Some doubt the Pareto for being not scientifically enough. Also it would be a result of selective perception. In this case, it is at least a trigger for you to consider and it could raise the question; Should we invest in forecast accuracy or flexibility?
This is where Ashby’s Law comes in. Ashby was an English psychiatrist and a pioneer in cybernetics, the study of complex systems. The theory of Requisite variety means that the system is resistant to any variance, as long as the system itself has more variance than its environment. An according quote: Only variety can destroy variety. So, in order to beat a bad forecast, and to prevent you having a bad day of service levels at work, you should create either more variety within your customer service, like enlarging the omnichannel way of working by adding more types of contact for instance. Or, diminish the variety on the customer side. You could think of call-me-back protocols or so. The system, here it is your contactcenter, will remain in control as long as there is enough variance to cope with the variance you get from calling customers. You should be able to anticipate on the expected variance you might get.
Let’s go to a bit of math. There are three V’s you can measure with. The first is variety. Variety is not really a mathematical word, the definition of variety is “A thing which differs in some way from others of the same general class or sort”. Like a set of data showing callcenter volumes per week. “There is a lot of variety in the amount of calls we get every week”. You should be able to tell whether your callcenter has a lot of variety in its weekly volumes.
The second is Variance. Now we get some math. Wikipedia says about variance: In probability theory and statistics, variance measures how far a set of numbers is spread out. A variance of zero indicates that all the values are identical. Variance is always non-negative: a small variance indicates that the data points tend to be very close to the mean (expected value) and hence to each other, while a high variance indicates that the data points are very spread out around the mean and from each other. The best know product of Variance is the standard deviation. The SD is the square root of the variance. The formula to get to the Variance is this: σ2 = 1⁄(N-1) • Σ(xi – μ)2
Now, this starts to look complicated right? Let me give you an example to clarify. Say you have the weekvolumes of the past six weeks. In the next table we’ve made them visual:
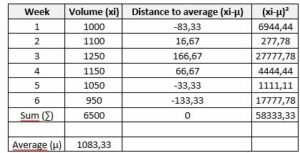
Now, our variance is 1 / (6-1) • 58333,33 = 11666,67. Because the variance is defined in a square number, we usually take the square root to get a number that gives you some feeling to it. The standard deviation you get has the same dimension as the data, and hence is comparable to deviations from the mean. You than get: √11666,67 = 108,0123. This number tells you that the standard deviation for these weeks is 108 calls. Assuming your calls have a normal distribution pattern, this tells you that 69% of your calls fall in between this margin of 108 calls from the mean. So in the bandwith of about 1000 – 1191 calls. Probably at twice the standard deviation you get 95% of your calls, in this example; 867 – 1299 calls. You could now say; when making your callcenter as flexible to up- and downscale from 867 calls to 1299 calls, you could get it right to staff correctly in 95% of the weeks.
Ready for one more? Volatility is the third V. As a matter of fact, this one is quite simple; you just divide the standard deviation by its mean and make a percentage of it. In this example you get: 108,0123 / 1083,33 = 0,099970 = 9,97%. The volatility of this callload is 9,97%. So, you’ve got a >10% deviation in 100%-69% = 31% of the times. The closer the percentage is to 0, the less volatile your callcenter is.
Defining the needed flexibility for your company, these numbers give you some insight in the amount of flexibility you need. It also makes it quite easier to explain the peaks in your performance. What you should do, when confronted with a highly volatile environment, is try smoothing it out. Make it less volatile. Otherwise, look at your staffing patterns and/or contracts and make them more flexible. Again; requisite variety tells you; the bigger the variety (read; variance or volatility) you face, the more variety you should build into your customer service. Start blending work, train to more multi-skilled people, etcetera. Hope this article gave you some insight on the matter.
Spril is a leading Dutch company in Workforcemanagement. Whether it is customer contact, healthcare or government; we are there. Our enthusiastic team of WFM professionals is available to help you excel in this profession. We do this with training, consultancy, analysis and interim solutions. In the Netherlands, Belgium and abroad.
